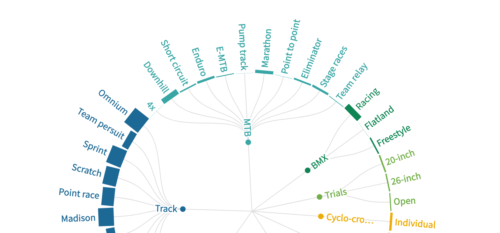
As a big fan of road cycling, and a little bit BMX and MTB, I became curious about what other disciplines exists in cycling. The visualisation below shows the wide range of what cycling on two wheels has to offer. The bars represent the number of events that took place in 2020.
Posts Tagged → cycling
De spannendste grote ronde
Deze data visualisatie laat zien welke grote ronde de afgelopen 5 jaar het spannends is geweest qua tijdsverschillen, trui dragers, hoogtemeters en aankomsten berg op.En wat blijkt, Alle edities van de Tour de France van de afgelopen 5 jaar waren minder spannend dan elke andere versie van giro en vuelta. De Vuelta 2018 was de meest opwindende! Continue reading
How ‘global’ is professional cycling?
With the excellent results of Dutch cyclists in recent years, I immediately rise to a nationalistic sense of pride. The Netherlands again takes a prominent place on the global sports stage. But how international is the sport, and how can I feel my sense of pride on a global level. I decided to delve into the data of UCI and Procyclingstats to investigate further. Continue reading
Flat races of the Tour de France are boring
The data visualisation below shows why the flat races in the Tour de France are not interesting to look at.
1) someone almost never wins from an escape
2) only 10 sprinters share 49 victories
The road to the podium of the Tour de France
This logarithmic line chart shows how the final top 3 of the last 10 editions of the Tour de France came about. Continue reading
