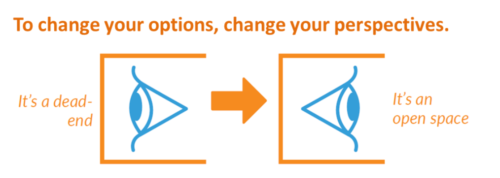
In the video below, Benjamin Zander explains how his students all score an A. I watch this video once in a while because it helps me to see people and the world in a different way. Below a ‘note to self’ with the 5 most important insights:
Continue readingPost Category → Uncategorized
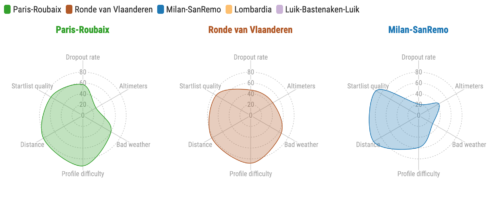
The hardest monument in cycling
The International Cycling Federation (UCI), does not know the term ‘monument’ but it is stated that it regards the oldest, longest and most prestigious classics in cycling. It is also the one-day races in which the most points can be earned in the World Tour (500 points for the winner).
Continue readingVisual over het visualiseren van informatie
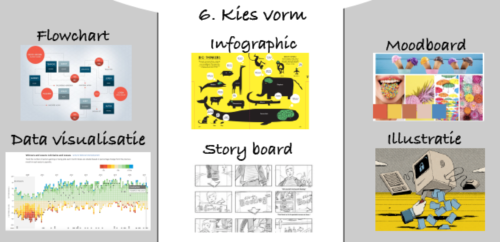
Als je informatie wilt gaan visualiseren helpt het om een aantal stappen standaard stappen te doorlopen om tot de juiste visualisatie te komen. Deze infographic heb ik gemaakt voor eerstejaars studenten van de opleiding Communications and Multimedia Design en visualiseert de stappen die moet nemen om op een effectieve manier informatie te visualiseren. Continue reading
Interactive data visualisation to explain drinking water quality analysis
During my MSc Thesis I investigated how drinking water quality data can best shared on online portals to inform the widest audience possible. I studied how data visualisation can make water quality data more insightful with the use of graphical representation of the data. In order to do this as well as possible, a mixed method was applied to initially find out more about drinking water quality data sharing by means of qualitative research, to finally test several types of interactive data visualisations through a quantitative research. Continue reading
10 SEO tips for website translations
In a previous blog, I discussed domain name selection when creating a multi-lingual website. This time I will take a closer look at the SEO structure that is required for a successful international website. The ten most important SEO translation tips that should be taken into consideration when translating websites are given below Continue reading


